 |
|
|
| Author |
Message |
Misty_Nikula-Ohlsen
Joined: 23 Mar 2004
Posts: 74
Location: Barrow, AK

|
 Posted:
Tue Jul 13, 2004 7:47 am Posted:
Tue Jul 13, 2004 7:47 am |
  |
Today we did the field measurements for Atqasuk. You probably know by now that the field measurements for each tower consist of measuring the thaw depth (with the steel rod), measuring soil moisture (with the Hydra Logger that I explained yesterday) and doing UniSpec Measurements along each of the transect lines. We also calibrate the IRGA. At the tower in Atqasuk there are transect lines in eight directions evenly spaced radially around the tower, beginning at true north (0 degrees) and continuing every 45 degrees. The transect lines are 200 meters long and have markers where we take readings spaced every 10 meters.
Kirstin and I did the measurements together because Kim needed to stay in Barrow to meet an incoming scientist, Dr. Kim, from the International Arctic Research Center (IARC) in Fairbanks who is coming for the week. He is going to be teaching our group how to take isotope measurements at the CMDL tower area and after he leaves we will need to take them once a week. So that left the field measurements in the capable hands of Kirstin and me.
So first thing this morning, while Kirstin called Tektronix, Inc in Oregon to see if they had a solution that would alleviate our need to open the portal, I went down to the airstrip to meet the Hageland plane. Jenny had put our equipment on the plane in Barrow to come down to us for do the field measurements and calibration.

Hageland bringing our equipment this morning
The plane was a bit late, about 8:50, so by the time I got back, Kirstin had contacted Tektronix and found out that we would need to send the equipment in to have the battery replaced and to have it re-calibrated, which costs about $1700! Not including shipping, of course. Then we set out with our thaw depth rod and soil moisture probes to do the first part of the readings. When we got to the tower, we were in a good mood because the weather was cool and windy which meant extra layers, but also NO MOSQUITOES!

Beautiful morning in Atqasuk
However, when we got to the tower we discovered that the soil moisture data logger wouldnt turn on and lo and behold it had no batteries! So back to the house we went.
[Note to self always check equipment BEFORE heading to the field.]
So about 45 minutes later, with properly working equipment, we started taking readings. Kirstin and I traded off after each transect. By the time we got to the third transect line (90 degrees) we had to put on our bug hats, though. The wind had died and the sun was coming out and so were the mosquitoes.

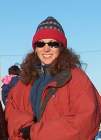
Yes, those are mosquitoes buzzing around my head, not birds
We finished the transect measurements for thaw depth and soil moisture, just at the right time. We were able to take down the IRGA for calibrating and open the portal at the same time. Then we headed in for lunch and calibration.
After we ate our leftovers from dinner for lunch, Kirstin walked me through the IRGA calibration, which I will explain in more detail in another post later this week, when I do one of the IRGAs from BEO or CMDL. Once the IRGA was ready, we got the UniSpec equipment ready and headed out again. At the tower, we reinstalled the IRGA and then took the UniSpec measurements. The mosquitoes were even MORE numerous than in the morning, but we foiled them with our bug hats and nasty spray. But the eerie whining sound that surrounded us constantly was a bit disturbing . . .

Crazy Mosquito Posse hovers around the tower
The UniSpec measures the reflectance of the tundra, that is, it measures which wavelengths of light are being reflected by the ground. It measures from about 350 nm to 1100 nm. Visible light is roughly from 380 nm (violet) to 740 nm (red), so this range includes ultraviolet and infrared light as well. A measure of the wavelengths of light that are reflected from the ground is an indirect measure of the productivity (plant growth) of an area. This is because chlorophyll, the pigment found in chloroplasts, which is where photosynthesis occurs in plants, absorbs primarily violet and red wavelengths of light. Since it absorbs these colors of light, the principal wavelength of light that is reflected by chlorophyll is green in color and thus plants look green to us.

The uv/visible adsorption spectrum for chlorophyll. (From James Steer, The Structure and Reaction of Chlorophyll, found at http://www.ch.ic.ac.uk/local/projects/steer/chloro.htm)
So as the UniSpec measures the wavelengths of light that are reflected, it is one way of measuring the plant growth. As you should know by now, if you have been reading my posts diligently, increased plant growth and photosynthesis would affect the carbon cycle by removing MORE carbon dioxide from the air.
The UniSpec itself records the wavelengths of light that are detected by a fiber optic sensor that is suspended over the tundra (or whatever surface you want to measure). The sensor looks at an area of the tundra that is about 2 cm in diameter when it is held about 2 m from the ground.

The fiber optic sensor in its high tech PVC holder
Before taking any measurements, the instrument needs to be calibrated to be sure that it is making correct measurements. First, it is calibrated for Dark Reflectance by placing a very sophisticated dark chamber over the sensor tip (actually it is a large black plastic trash bag folded over many times and taped up into an envelope of sorts.  ) Then the UniSpec takes a measurement which is set as Dark. It compares other measurements to this low end measurement. ) Then the UniSpec takes a measurement which is set as Dark. It compares other measurements to this low end measurement.

Setting the Dark Reflectance
Next the UniSpec is calibrated for Total Reflectance by placing a bright white object in front of the sensor tip and taking another reading which is set as Reflectance. The instruments can then compare other measurements that are taken to this high end measurement.

The white object used for setting Total Reflectance (notice the presence of more high tech equipment)
These calibrations are done at the beginning of each transect and any time that the sun level changes dramatically, like from overcast to sunny, since the amount of light from the sun can affect the calibration and reflectance levels.
After calibrating the instrument for dark and light objects (total absence of reflectance and total reflectance), we take one reading at each transect marker and save it to the mini-computer. Here I am taking a measurement:

Taking at UniSpec measurement
Here is an example of what the readout looks like:

The mini-computer readout of a UniSpec measurement
We only take UniSpec measurements on the four cardinal point transects, North, East, South and West, so the field work went pretty fast (only 80 measurements!). When got back to the house, we worked on downloading and recording all of various the bits of data that we collected. We had much to do. The soil moisture data had to be downloaded from its data logger and the DOS file that converts the raw measurements to water by volume percent had to be run; the thaw depth data had to be transcribed from the tape recording into the running Excel spreadsheet; yesterdays flux data had to be processed; and the UniSpec data had to be downloaded and processed.
I worked on processing the UniSpec data with a program called MultiSpec. I followed the written procedures and the program calculated a number called Normalized Difference Vegetation Index (NDVI). I did not know what this was so I looked it up on the Internet. According to a website from Arizona State University:
| Quote: |
| The NDVI is an index that provides a standardized method of comparing vegetation greenness between satellite images. Index values can range from -1.0 to 1.0, but vegetation values typically range between 0.1 and 0.7. Higher index values are associated with higher levels of healthy vegetation cover, whereas clouds and snow will cause index values near zero, making it appear that the vegetation is less green. |
(http://rangeview.arizona.edu/glossary/ndvi.html)
I also found another TOTALLY AWESOME website which explains NDVI and what it tells us about the vegetation of an area very well. It explains exactly how the calculation is done and why it tells us what is does. The website can be found at:
http://earthobservatory.nasa.gov/Library/MeasuringVegetation/measuring_vegetation_2.html
I strongly suggest you check this one out if you are interested in learning more; it is very well-written and has a lot of interesting images and information.
Later this week, when I get back to Barrow, I plan to ask Marcus, a graduate student from Michigan State University who is working here this summer, some more of my questions about the UniSpec and NDVI, since this is one of his research areas. When I find out some more about the hows and whys of UniSpec and NDVI, I will fill you in. |
|
|
     |
|
|
|
|
View next topic
View previous topic
You cannot post new topics in this forum
You cannot reply to topics in this forum
You cannot edit your posts in this forum
You cannot delete your posts in this forum
You cannot vote in polls in this forum
You cannot attach files in this forum
You can download files in this forum
|
Powered by phpBB 2.0.11
© 2001, 2002 phpBB Group :: FI Theme ::
All times are GMT
| |