( Log In ) Log In is for TREC Teachers & Researchers only
  |
| Betty_Carvellas |
 Jul 10 2006, 09:11 PM Jul 10 2006, 09:11 PM
Post
#1
|
 TEA Teacher    Group: TEA Teacher Posts: 41 Joined: 6-July 05 Member No.: 20 |
July 7, 2006
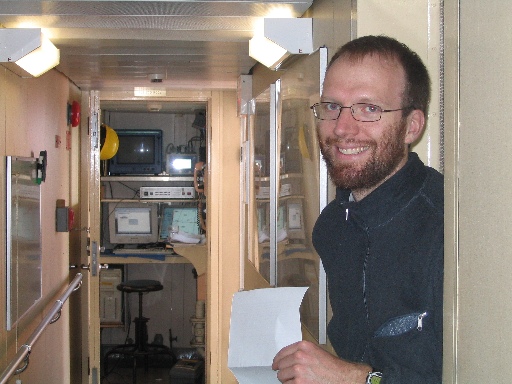
Dr. Bill Williams is Chief Scientist on this leg of the cruise from Victoria, BC to Dutch Harbor, Alaska. I spoke with him today after he gave a science talk for scientists and crew. In the talk, Bill gave an overview of the goals of this part of the cruise and he told little about each of the different science projects. Bill knows all this because, as Chief Scientist, it's his job to coordinate all the science on board, to facilitate communication between the scientists and the crew, and to maintain communication with those on shore regarding questions, coordination, supplies, and any other issues which might arise. In addition, some members of the science team are at sea for the first time, and it's Bill's role to "train" them and get them acquainted with the work involved when doing science at sea. His is a "round the clock" job!  Dr. Bill Williams is the Chief Scientist for the first part of this cruise. Down the hallway in this picture, you can see the small room where the CTD operator sits during each CTD cast. Bill received his doctorate in physical oceanography from the University of Alaska Fairbanks. He's currently a visiting fellow at IOS (the Institute of Ocean Sciences) in Victoria, BC. In addition to the above mentioned duties, Bill oversees the work with the CTD, the XBT, and the thermosalinograph. I've already told you about the XBT so I'll fill you in on the other two. The CTD collects data on conductivity, temperature and depth, and sends it all back to a computer. It is lowered over the side of the ship in a frame that also carries a rosette of 12 water sampling bottles. These bottles are designed to close when triggered and so can collect water from different depths. So far, we've done CTD casts twice a day, sending the rosette to 1000 meters, and then raising it, closing the bottles at a set series of depths. The best data for the CTD is collected on the way down when the water is undisturbed by the rosette.  The CTD goes in twice a day, collecting water and data at certain depths on its way down and and up from 1000 meters. Other equipment on board the CTD includes a transmissometer, a fluorometer, and a dissolved oxygen sensor. The transmissometer shines light at one end over a 25 centimeter (about 10 inches) length to the other end. The amount of light that reaches the other end gives an indication of the clarity of the water. The fluorometer measures the fluorescence of chlorophyll which gives an indication of the concentration of phytoplankton. This works because phytoplankton are small, drifting plants, all containing the chlorophyll needed for photosynthesis. The dissolved oxygen sensor measures exactly what its name implies, the amount of oxygen dissolved in the water. That takes care of the CTD, one of the most important and, at approximately $100,000, one of the most expensive pieces of equipment on board. The thermosalinograph is set up in the lab and pumps water continuously while the ship is moving. It gives a continuous record of the temperature and salinity (salt concentration) of the surface water.  The thermosalinograph is set up in the corner of the lab. It pumps water continuously while the ship is underway providing a continuous record of the temperature and salinity of the surface water. Since this is the first time the Laurier has carried IOS scientists from Victoria, I asked Bill about the work he's been doing as we move across the Gulf of Alaska. He told me that he is looking for temperature intrusions that indicate the boundary between the Gulf of Alaska gyre and the sub tropical gyre in the south. If you look at a picture of his temperature data, you can see where the warm sub tropical water actually seems to intrude (move into) the colder Alaskan water. Scientists are trying to find out how different water masses on either side of the front behave and interact. Why? You might have heard of a biome, a large geographic area with characteristic ecosystems (living and non living features). Ocean biomes are associated with physical regions, but the boundary between them may move under scenarios of climate change. One idea is that, if the functioning of the ocean is producing these fronts, a changing climate might cause their location to shift and so redraw the boundaries of the biome. Once Bill leaves the ship in Dutch Harbor, he moves to a different ship on the Mackenzie shelf, the area just off the coast of northern Canada where the Mackenzie River empties into the ocean. By studying the ecosystem there, scientists hope to have more information available to regulate oil exploration in the area. |
  |
1 User(s) are reading this topic (1 Guests and 0 Anonymous Users)
0 Members:

|
NSF Acknowledgment & Disclaimer | Time is now: 19th November 2024 - 03:36 PM |
Invision Power Board
v2.1.7 © 2024 IPS, Inc.


