( Log In ) Log In is for TREC Teachers & Researchers only
  |
| Maggie_Kane |
 Jul 26 2006, 03:47 PM Jul 26 2006, 03:47 PM
Post
#1
|
 Advanced Member    Group: TREC Team Posts: 51 Joined: 12-April 06 Member No.: 27 |
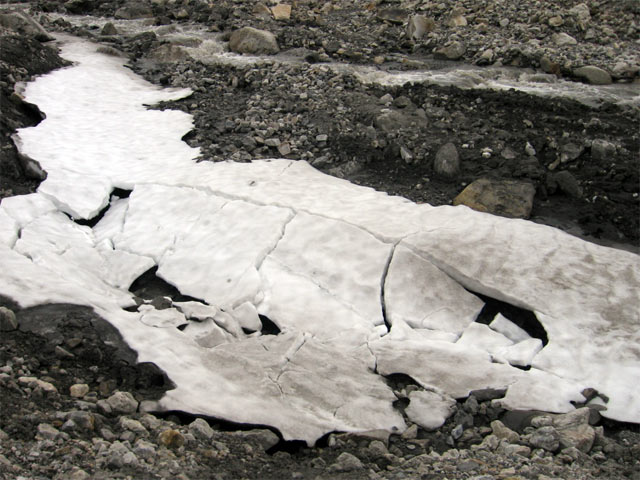
Today we had several different things to do, so we split up to get to three different locations: the glacier, the upper ISCO and a lower ISCO. The high valley groups left early in the morning so that they could cover the ground they needed to cover and still try to get back in time for dinner. The glacier group found that a lot had changed in only 2 days since they were last there. The ice is melting really fast right now - this snowbank was not slumped at all before today.
Snowbank Melt  This wooden box was in a picture from my postings 2 days ago, sitting flat on the ice. You can see that the ice is melting all around the box as the sun circles, and that the level has dropped 8-10 cm! That's fast! Melting out the Box  Here is a look at the coarse grainsize of the glacial ice. It is about the size of corn kernels. Heather tells me that the snow looses it's pretty flake shape as it turns to glacial ice through a slow compaction called "firnification". The molecules bind together differently giving it this coarse look. Firn Crystals  Eric and Heather are the two students primarily working on the glacier. Our Glacial Hero’s  They installed a radiation shield which has instruments within it that will measure the relative humidity (moisture content of the air) and temperature every 10 minutes. This instrument is located at ablation stake 7 which is very high up the glacier. Radiation Shield with Instruments Inside  They also installed a precipitation bucket. This will collect rain and snow as it falls on the glacier and record the amount. All this tells us a lot about the conditions on and around the glacier. Doesn't the surface of the glacier look neat? Rain Bucket  Meanwhile, the lower valley groups hiked to the 2 water samplers and collected the 24 bottles at each one that had collected samples over the past 2 days. They also made plans to place a camera up high on a terrace and program it to take a photographs of the stream delta as it enters the lake. This will be powered by the other huge battery and a solar panel, and will sit inside a box all winter, taking pictures of the valley. Question of the day: first, think about what a line graph will look like showing data from a rain gauge if there were 3 big rain storms over a period of time. If we plotted time along the bottom (x axis) and the amount of rain going up along the side axis (y axis) it would perhaps show 3 big spikes where the storms occurred, right? Now think about snow in the winter. Since it won’t melt until spring (or at least a really warm day in the winter) the rain gauge won’t know the snow is there until it turns liquid. What would we expect to see for the winter months? What would the graph look like when it finally get gets warm? Post me a response on the “ask the teacher” site and I’ll run it past Heather and Eric. |
  |
2 User(s) are reading this topic (2 Guests and 0 Anonymous Users)
0 Members:

|
NSF Acknowledgment & Disclaimer | Time is now: 31st October 2024 - 07:34 PM |
Invision Power Board
v2.1.7 © 2024 IPS, Inc.


